Google Analytics is a powerful tool that you can use to gain insights about how visitors interact with your website. Once installed, Google Analytics provides behind-the-scenes details about your site visitors, site visits, session times (and lengths), conversion goals, and so much more.
Google Analytics makes several reports available to you and even allows you to customize these reports. However, if you’re a newbie, all this information can be overwhelming, to say the least. But once you understand how to use this powerful tool, you can use it to make the necessary improvements that bolster your SEO efforts.
The single best way to understand the ins and outs of Google Analytics (and gain some digital marketing street cred) is to go through their free certification program.
The major downside to an investment in this effort? It takes many hours to get through the training material and the resulting certification is only valid for 18 months. This can be hard to justify on-the-job and makes for a tough break in your personal life if you have to devote a weekend to it!
If you’re ready to get more out of Google Analytics now and want to put off the certification process, there’s good news. You don’t need to know everything about Google Analytics to be effective—you just need to familiarize yourself with some popular reporting features that give insight into SEO.
Follow along with our guide to the five most useful Google Analytics SEO dashboards—and how to use them effectively to grow relevant traffic to your website.
#1 Technology Report
The Technology Report provides you with visitors’ browser, OS (operating system), and network information. If you want to go in deeper than that, this report also provides information relating to Screen Resolution, Screen Colors, Flash Version, and Java Support that your audience uses.
The Technology Report can be accessed by going to Google Analytics > Audience tab > Technology.
The Technology Report provides you with visitors’ browser, OS (operating system), and network information. If you want to go in deeper than that, this report also provides information relating to Screen Resolution, Screen Colors, Flash Version, and Java Support that your audience uses.

What the Technology Report can tell you:
This is the default report you see when you click on the Technology tab. It provides you with details about the most popular browsers that access your website.
What makes this report important is when you use it to suss out odd behavior: perhaps a high bounce rate or a low average session duration for a certain browser. These metrics might indicate that your website does not register well on that browser. Informed by the Technology Report, you’ll want to visit your website using that browser to check for problems so you can make any necessary tweaks.
This same approach is also applicable to other variables detailed in this report.
For example, screen resolution analytics shows you the most popular screen size your audience uses, which is an important consideration for designing your website. You can also look at Flash and Java support reports and mix what you find in with data from your browser reports to see if browsers are properly supporting these elements.
Why the Technology Report is important:
The Technology Report provides useful insight regarding your website’s user experience, which can help you infer why audiences spend a certain amount of time on your website.
Search engines are more likely to rank websites that provide a good user experience and at the same time, more people are inclined to visit a website that offers a good user experience, or that is highly recommended by search engines. In that way, both user experience and SEO go hand-in-hand with a common goal of giving your site visitors the best experience.
#2 Queries Report
Google Analytics now supports Search Console Data, which provides information about your organic search traffic along with site engagement data like bounce rates, views, and impressions.
According to Search Engine Land, what makes Search Console data different from Google Analytics data is that it also provides click data, which means it only counts visits that came from the Google search engine to your website, versus Google Analytics, which also counts traffic from other sources.
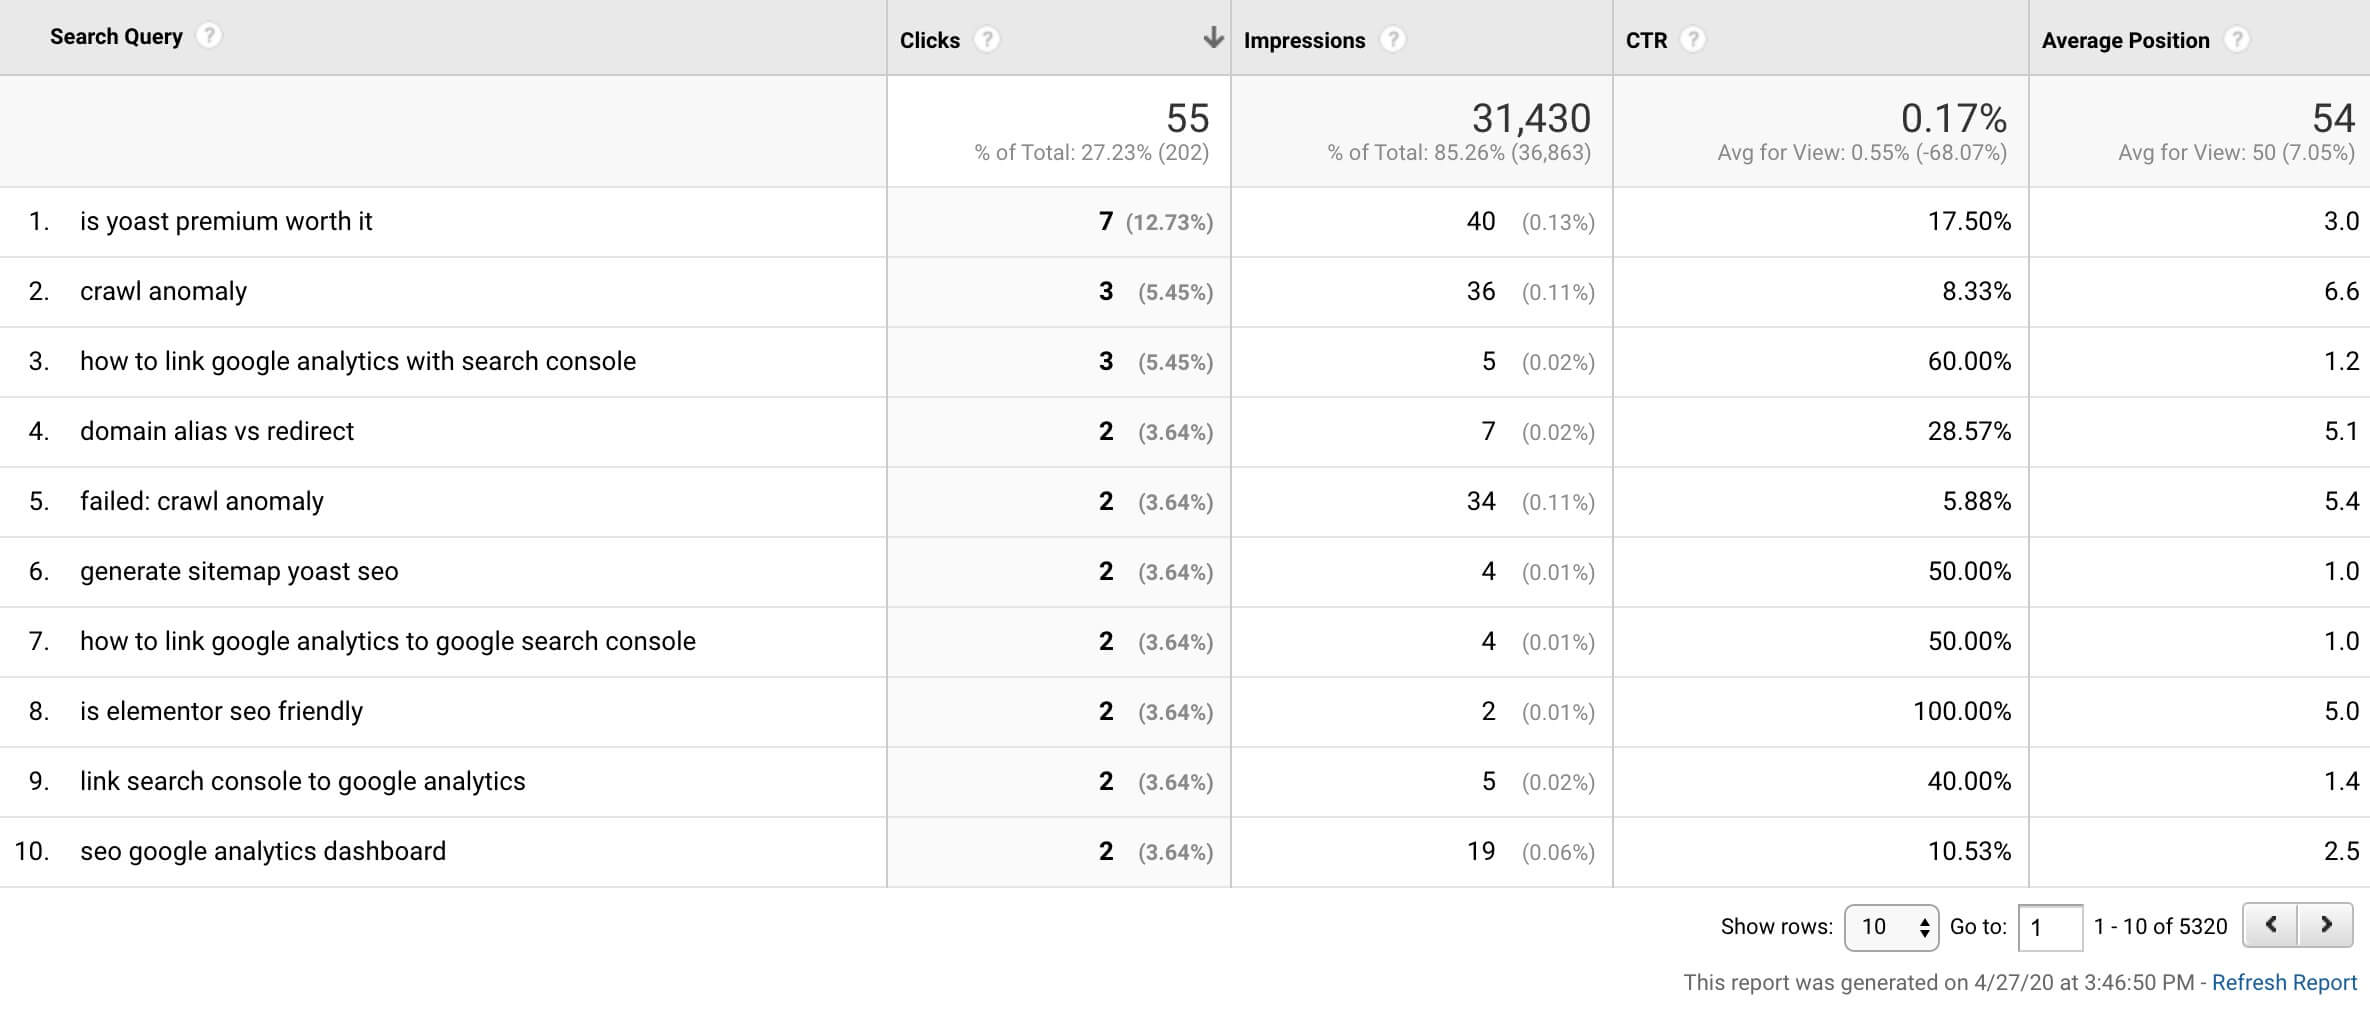
One of the most important Google Analytics SEO dashboards is the Queries Report, which allows you to see exactly what terms people search for to get to your website.
This report can be found under Acquisition > Search Console > Queries.
What the Queries Report can tell you:
This is the default report you see when you click on the Queries tab. It shows you search query terms, along with related clicks, impressions, CTRs, and your average ranking position.
- Impressions show the number of times your website appeared on the Google SERPs (search engine results pages) for a given term, including where images come up in relevant search results. The Queries Report also shows you when your content isn’t ranking on the first few pages of the SERPs. This is why this report also shows you average position data.
- Average position data: Usually, Google displays search engine results in multiples of 10 (results 1-10 are on the first page, 11-20 in the second, and so on). The Queries Report shows what position your website ranks for when it comes to that particular search term. For example, the above screenshot shows that this website ranks 1.2 for the term “youtube merch” which means that they ranked first for the query in some searches, 2nd in others and that the average of all these is 1.2.
Why the Queries Report is important:
You can use this report to do brand vs non-brand searches.
According to Search Engine Journal, excluding brand impressions and clicks shows the true extent/visibility of your SEO efforts. At the same time, reviewing brand only searches can show if your brand’s strength is growing over time.
You can use the Queries containing and Queries not containing filter to review brand and non-brand searches, respectively.
A related Google Analytics SEO dashboard can be found by navigating to Acquisition > Channels > Organic Search. For most, this report is all but useless because Google protects the data of users browsing with a secure (SSL) connection.

Oftentimes, the (not provided) keywords represent a bulk of all search queries that result in clicks through to your website.
If you want to know what these terms actually are, you can use a tool like Keyword Hero to reveal the exact queries. Best of all, this tool connects directly to your Google Analytics account! Keyword Hero also provides users with a range of pre-built Google Analytics SEO dashboards to support your understanding of your website’s performance.

If you can’t see the Search Console reports on your Google Analytics account, check first to ensure that your website is configured with Search Console. If it isn’t, you have to add your site on Search Console to collect search query data, and then configure SEO reporting on Google Analytics.
A final note in relation to the Queries Report: you can also access data relating to internal/on-site searches by going to Behavior > Site Search > Overview. Just make sure to set up site search, first!
#3 Traffic Acquisition Report
In relation to the Queries Report is the Traffic Acquisition Report, which gives an overview of traffic acquisition: from sources of traffic to the number of users, to session duration, and conversion rate.
While traffic acquisition information is easily available to view in your Google Analytics overview, making your way to Acquisition > All Traffic > Source/Medium will provide you with much more detailed information.
In the overview, all traffic from search engines is lumped under organic traffic but in the Source/Medium Report, it shows you what specific search engine the traffic came from.

#4 Page Load Time Report
One aspect of SEO that is often overlooked is page load times.
According to a study by kissmetrics, about half of users expect a website to load in two seconds or less, and 4 out of 10 users would abandon a website that took more than 3 seconds to load.
This isn’t just important for e-commerce websites. Page load speeds don’t just affect conversion rates but the entire user experience as well, which affect your page rankings for any type of website. If you’re spending a lot of time and money to affect SEO and keyword rankings, do not neglect page load speeds.
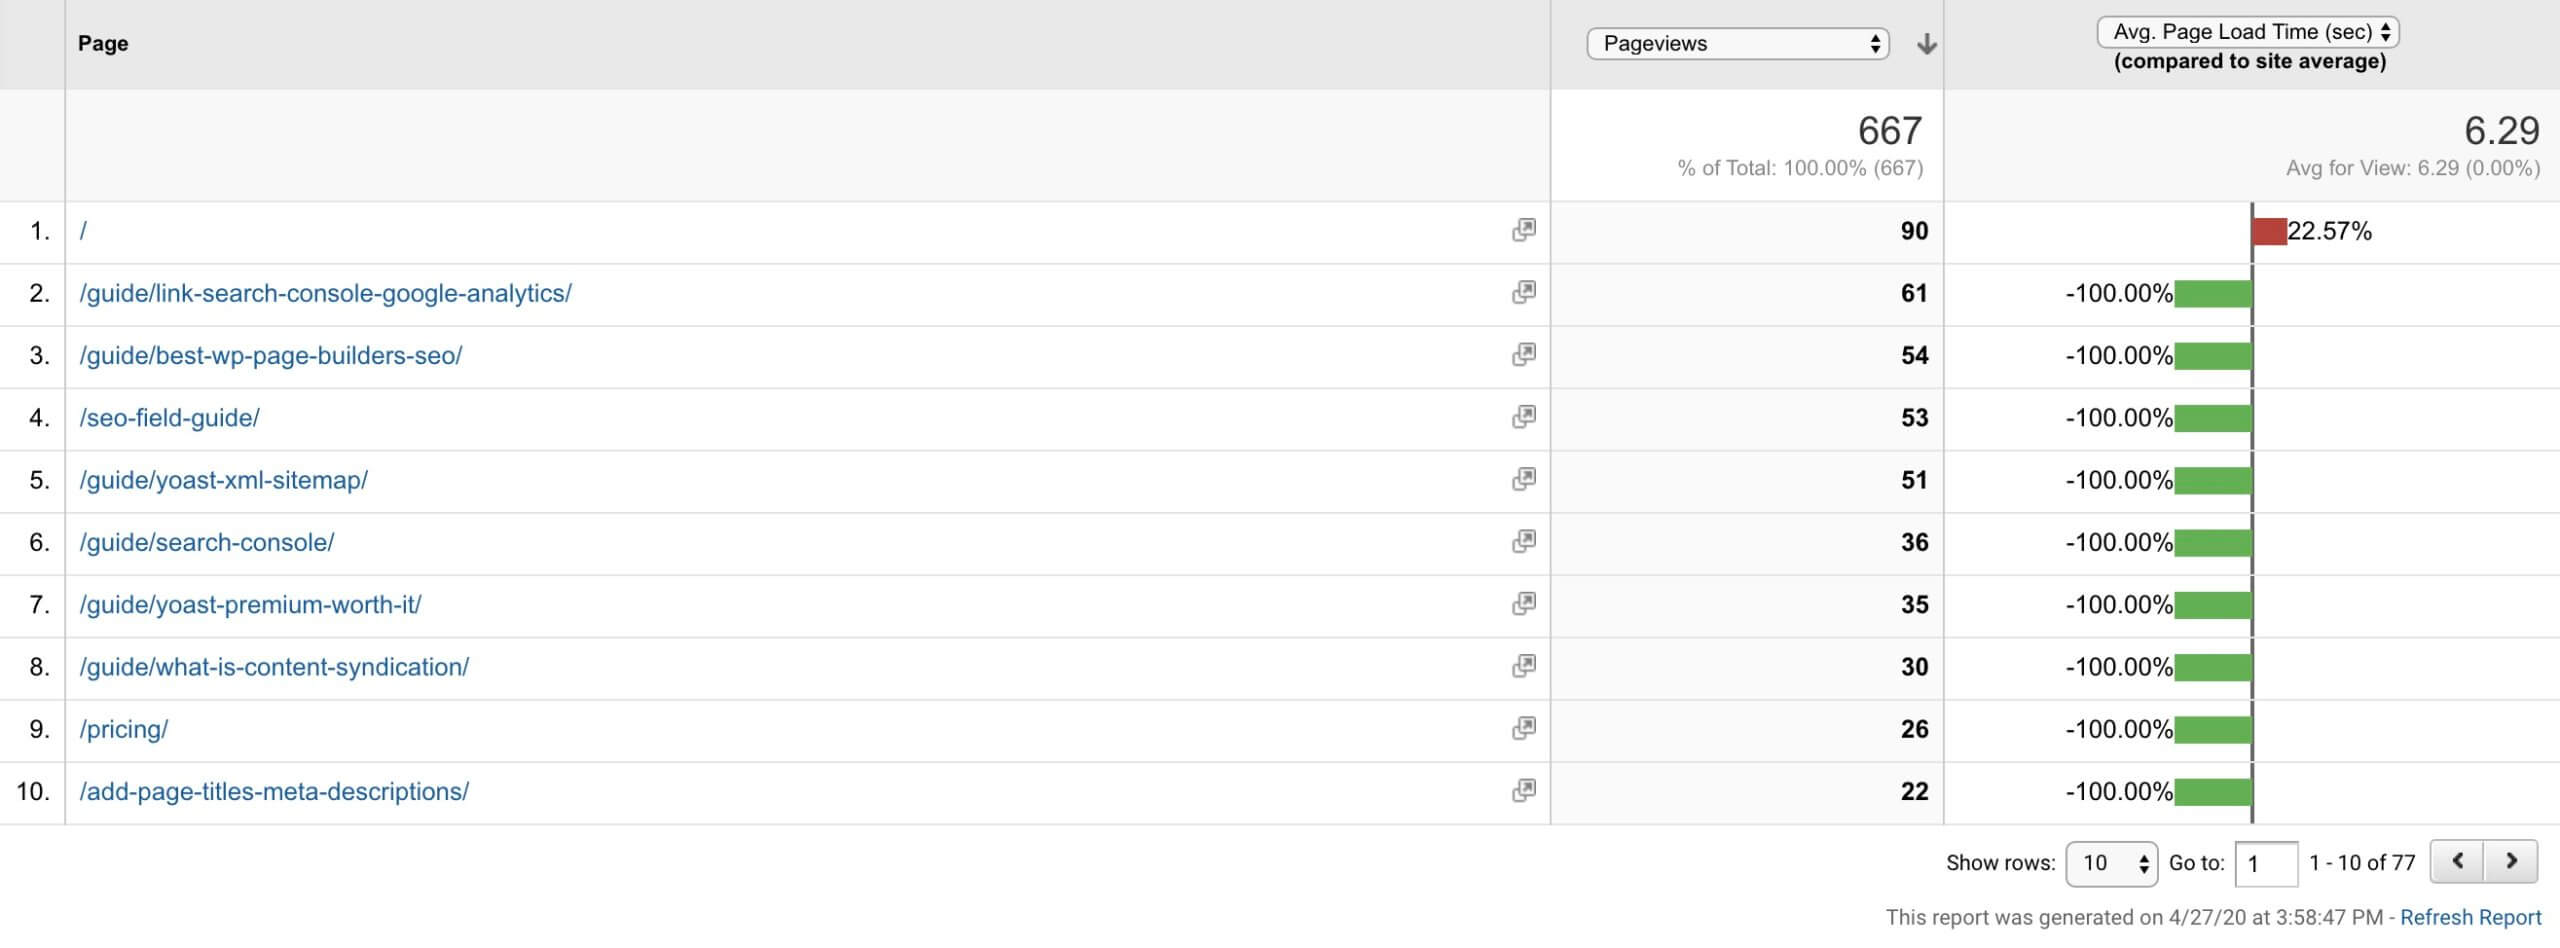
The first step to determining whether you need to make any changes to your website is to do an audit, and the Page Load Time Report can help you with this.
To access this report, go to Behavior > Site Speed > Page Timings.
You can change the headings depending on which metrics you want to compare but it is suggested that you stack Average Page Load Time against % Exit, like so:

In this example, you can see instances where the sitewide average page load time is less than most of the pages, and that when the average page load time of a page exceeds that of the site’s average page load time, the exit rates are also greater (there’s a direct correlation).
Armed with this information, you’ll want to discuss how to improve page load times with your website developer. After they’ve implemented changes, you can compare your new data with the old to see if your traffic and conversions have improved due to improved page load times.
#5 All Pages Report
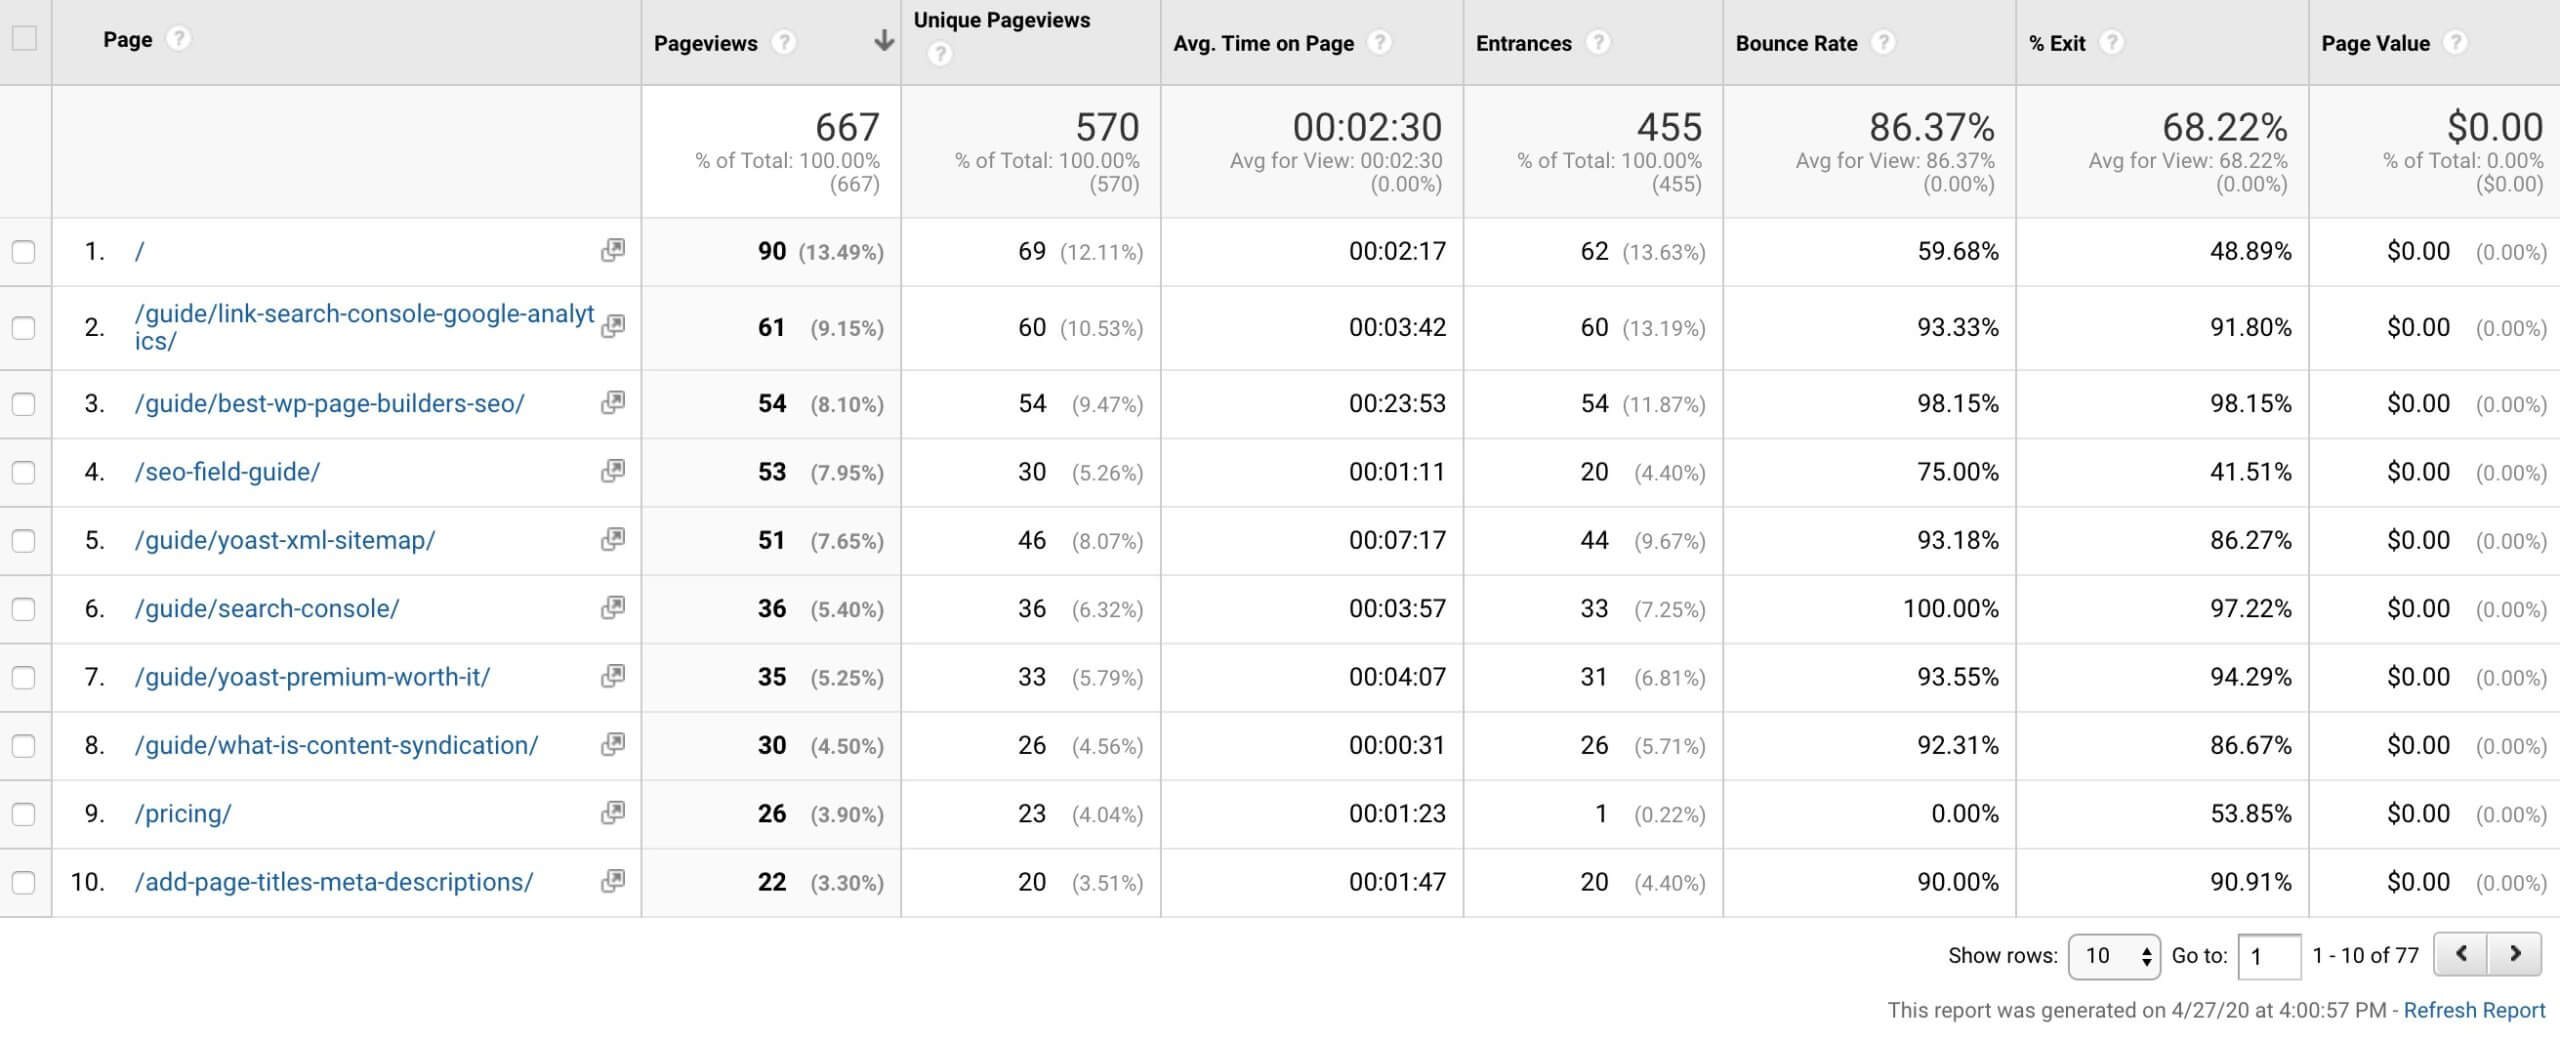
Since most SEO efforts center on content creation, it’s important to measure your effectiveness with these efforts. This is where the All Pages Report comes in.
Access this by going to Behavior > Site Content > All Pages.

With this report, you’ll see all the content that people are viewing on your website, arranged by pageviews.
Why the All Pages Report is important:
What makes this report important is that there are so many insights you can gain from it, pageviews and bounce rates aside.
One metric you might want to consider is page value, which uses your goal conversion data (something you’ll have to setup within Google Analytics) to determine which pages create the most monetary value for your website.
You can also take a look at the Entrances and % Exit metrics, to show you from which pages people access and leave your site.
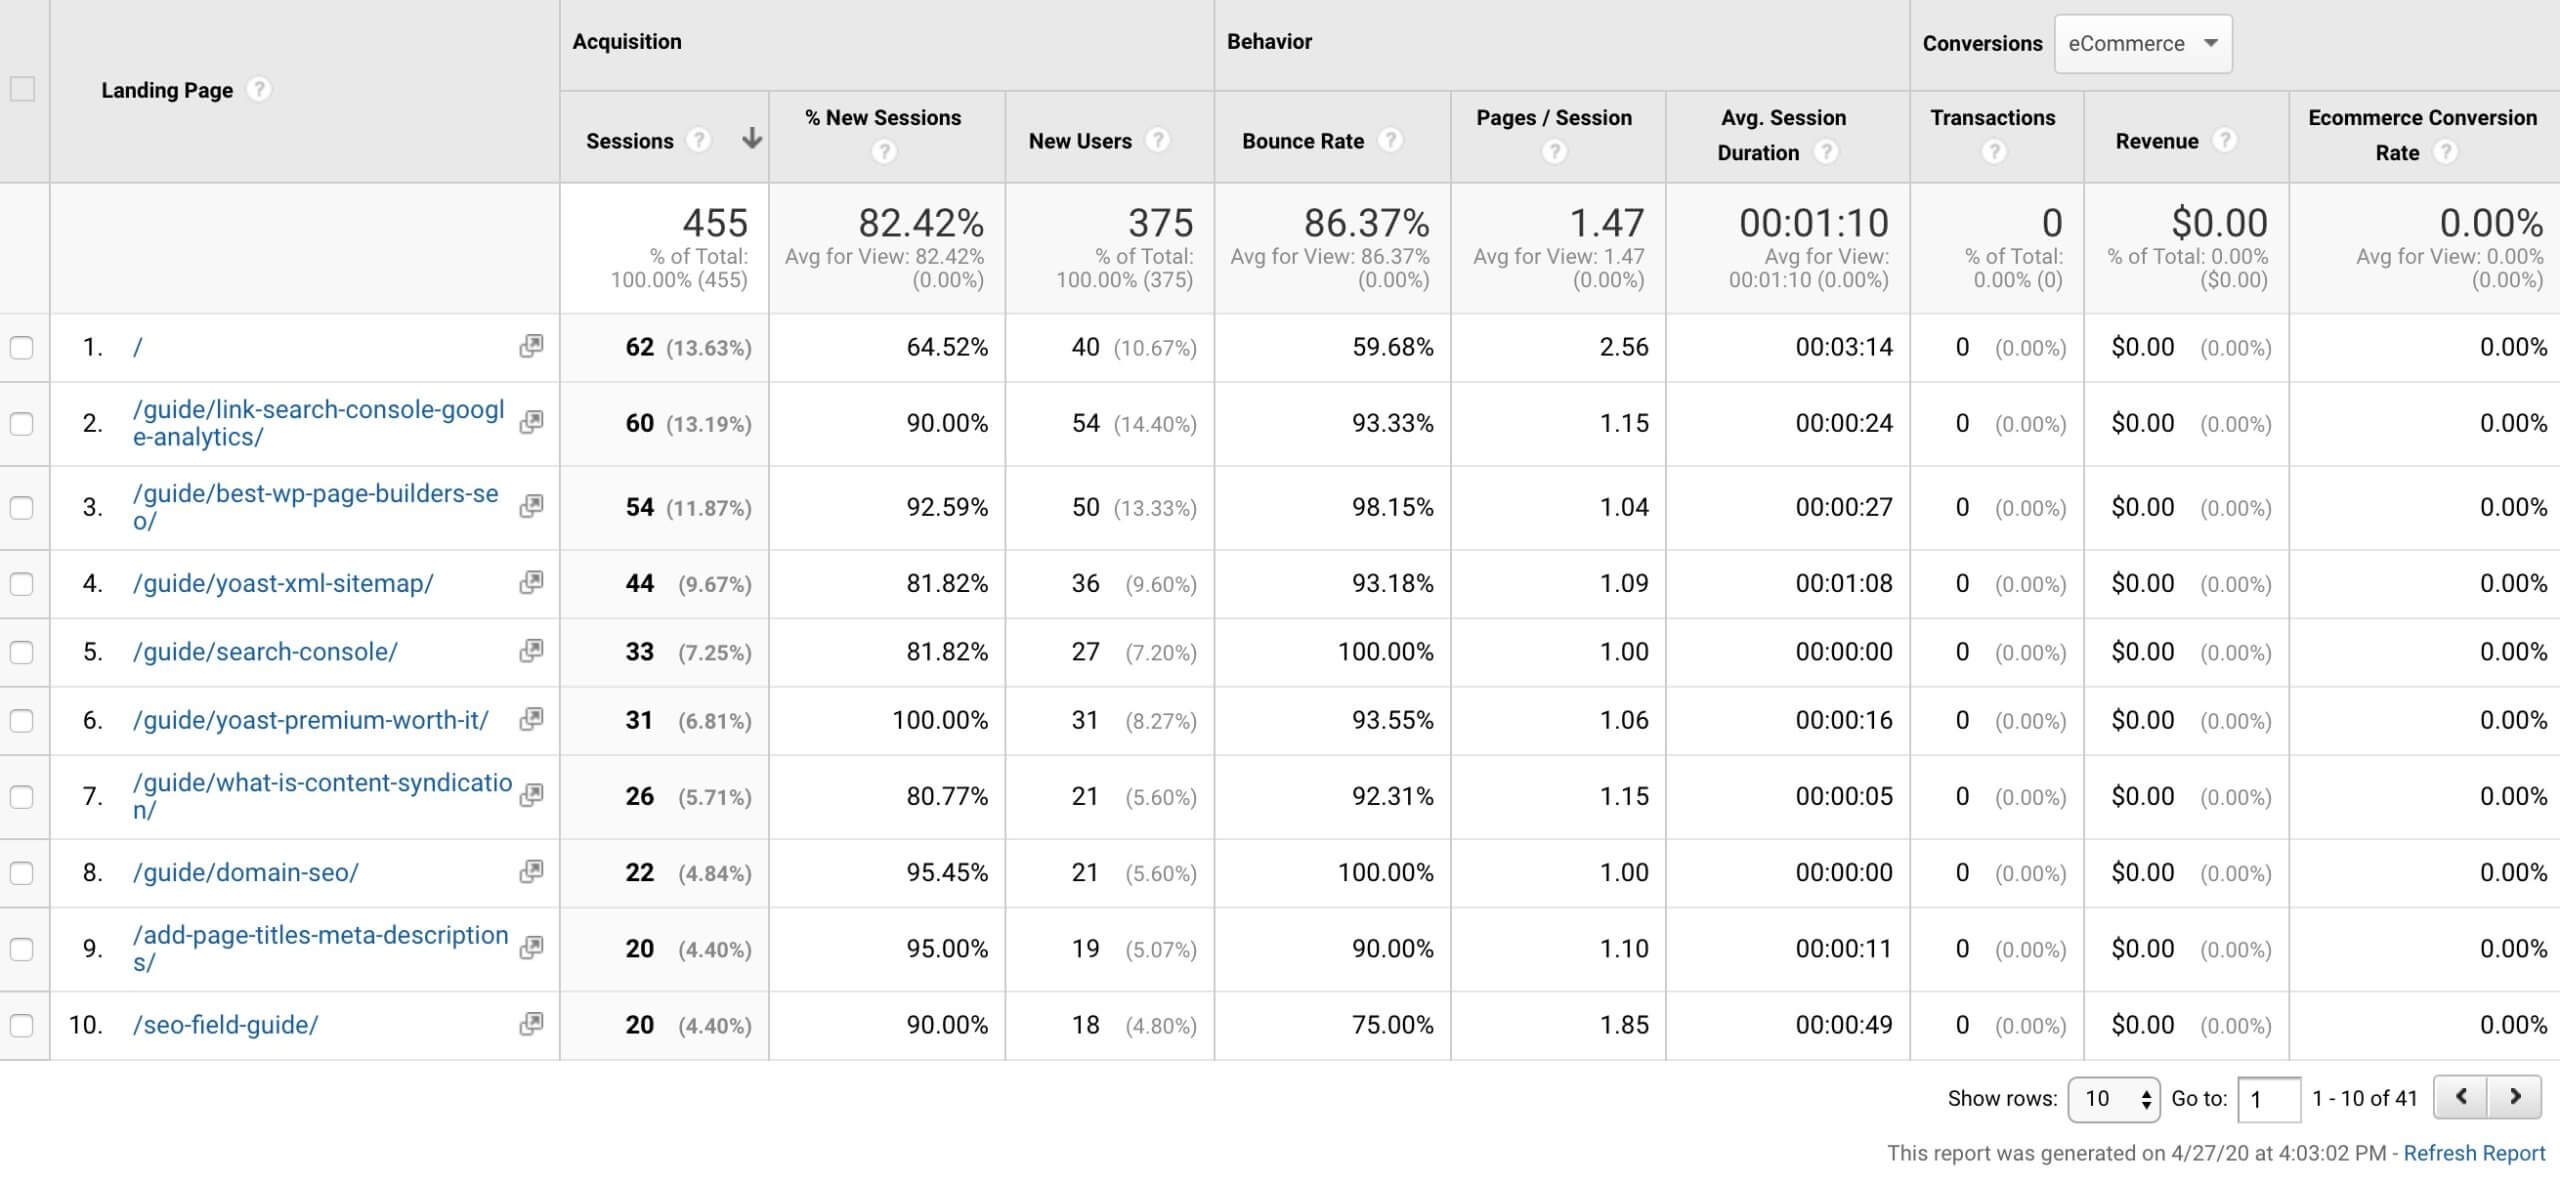
Similar to the All Pages Report, you can also check out the Landing Pages report to help you understand what content brings people to your website (and the first page they see).

Final Thoughts: The 5 Most Useful Google Analytics SEO Dashboards to Grow Traffic
Google Analytics is a helpful tool that measures many different web marketing metrics. With the amount of data and metrics to keep track of, this sheer abundance of data can seem overwhelming for new users.
Luckily, these five Google Analytics SEO dashboards are among some of the most useful reports you can use to improve your website and drive more relevant traffic in line with your SEO efforts. Get familiar with each one and consistently check-in to catch red flags before they become bigger issues.
Don’t forget to add Google Analytics to your Pathfinder SEO account for a BONUS Google Analytics SEO dashboard! We simplify and streamline the data to focus on the most important metrics to help you get found in Google, Yahoo and Bing.